No Sleep For Alcons In Seattle @ USITT 2024


Alcons Audio’s pro-ribbon based sound systems will be featured extensively at this year’s US Institute...

Award-Winning Mix Facility “Solidly Booked” After Pro-Ribbon Installation
Read more

a world class facility, built for musicians and jazz aficionados, named Best Jazz Club by Vegas Magazine
Read more

a musical PA with enough headroom from the lowest ends all the way up to the high-resolution highs,
Read more

Rock, Pop, DJ and Metal reinforced how and where as intended
Read more
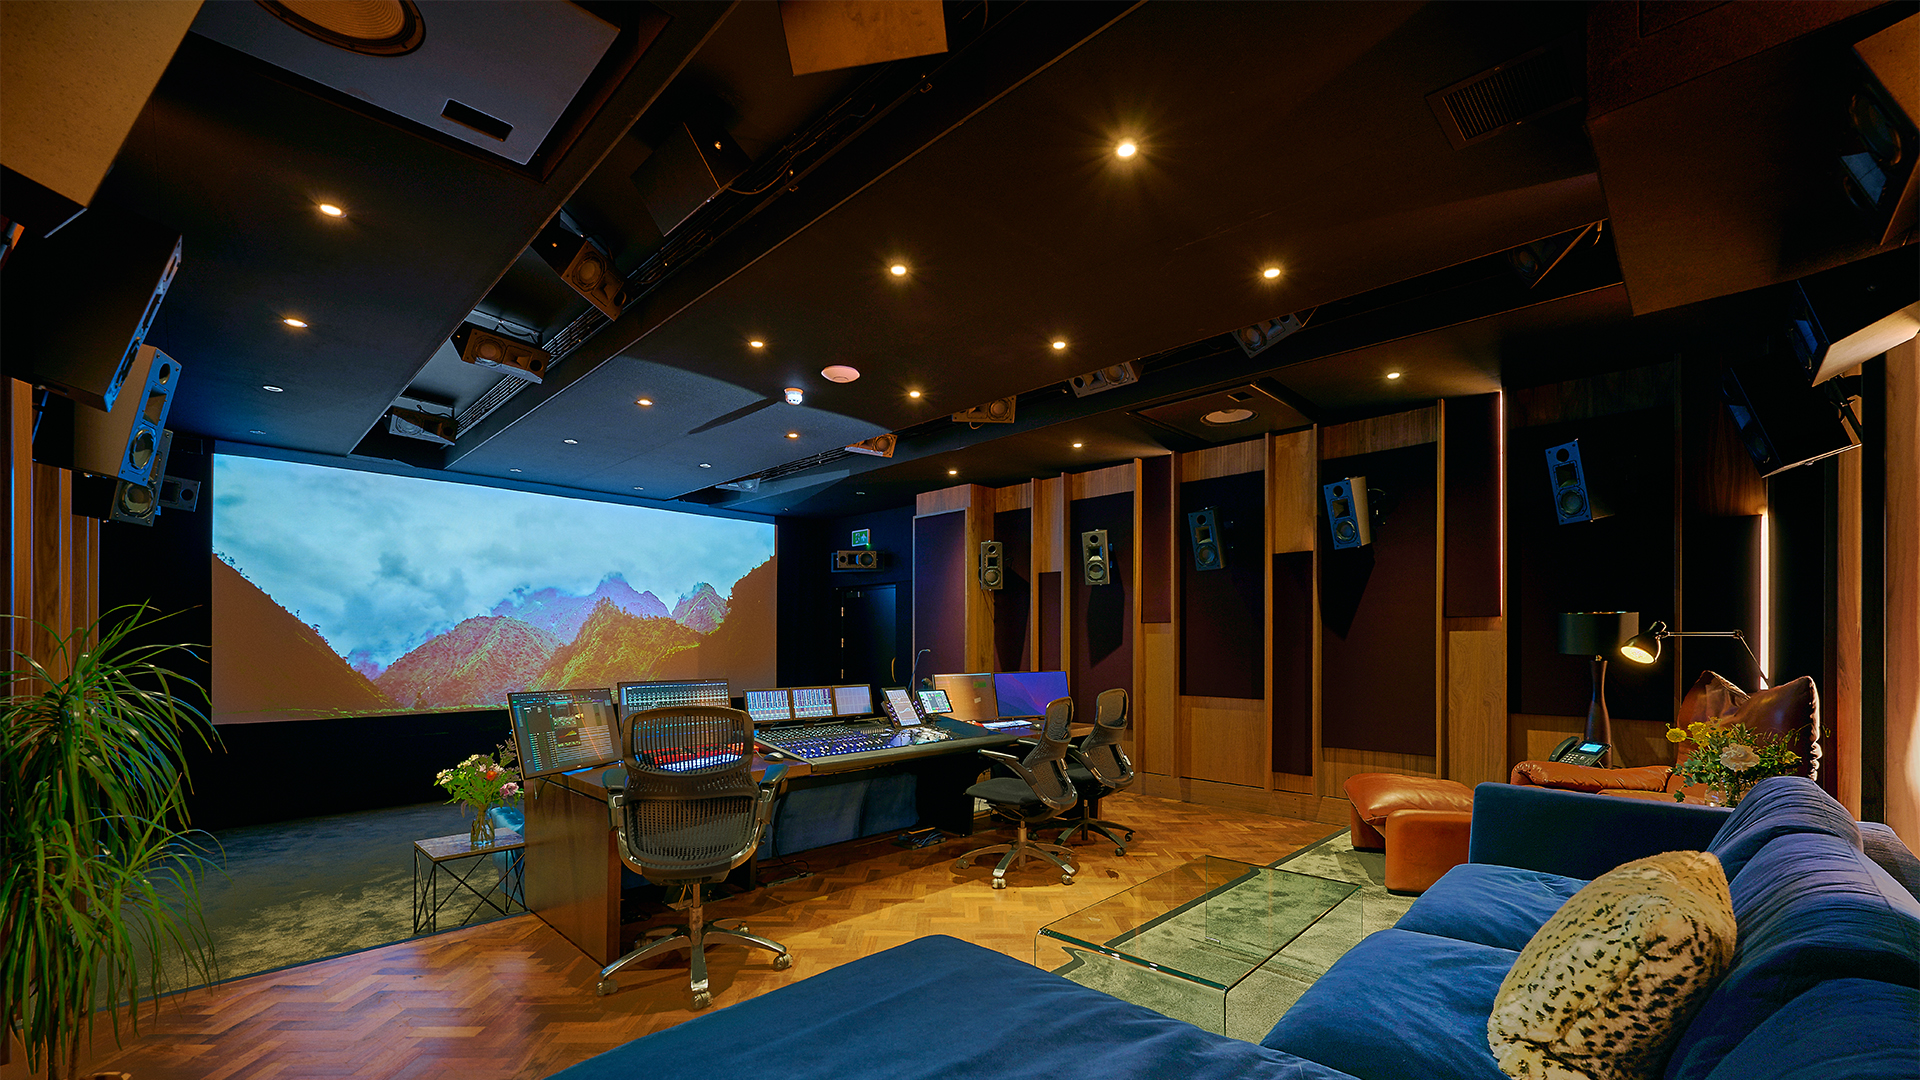
CRMS is the new post-production reference
Read more

Our New Line-Array Delivering Power With Clarity And Control
Read more

Expanding Q-Series Problem-Solving Power
Read more
Subscribe to the Alcons newsletter and stay tuned


